Advanced Research Methods with SPSS and Stata
- Description
- Curriculum
- FAQ
- Reviews
- Grade
Diploma in Applied Research Methodology Using SPSS and Stata
Learn how to master advanced research techniques using SPSS and Stata for data analysis, enabling you to conduct rigorous and insightful research.
Course Overview:
- Introduction to Applied Research Methodology
- Understanding Data Types and Variables
- Data Cleaning and Preparation Techniques
- Exploratory Data Analysis
- Hypothesis Testing and Statistical Inference
- Regression Analysis in SPSS and Stata
- Data Visualization and Interpretation
- Advanced Techniques in SPSS and Stata
Key Learning Objectives:
- Gain proficiency in using SPSS and Stata for data analysis
- Understand the principles of applied research methodology
- Develop skills in cleaning, preparing, and analyzing data
- Learn advanced regression analysis techniques
- Interpret and communicate research findings effectively
Course Duration:
This course is self-paced and estimated to be completed within 4-6 weeks based on an average study time of 5-7 hours per week.
Language:
English (en_US)
-
1
 Research Design Fundamentals
Research Design Fundamentals are essential for conducting a successful study. Understanding the key components of research design, such as defining the research problem, selecting the appropriate methodology, and collecting and analyzing data, is crucial for producing reliable and valid results. By following these fundamentals, researchers can ensure that their studies are well-organized and effectively contribute to the existing body of knowledge. Whether conducting quantitative or qualitative research, having a strong grasp of research design fundamentals is crucial for producing high-quality research outcomes.
-
2
 Understanding Data Collection Methods
Understanding Data Collection Methods
Data collection methods are essential for gathering accurate and reliable information. Whether using surveys, interviews, or observational techniques, it is important to understand the various methods available and choose the most appropriate for your research objectives. By selecting the right data collection method, you can ensure the quality and validity of your data, leading to more meaningful insights and conclusions. Familiarize yourself with the different approaches to data collection to maximize the effectiveness of your research efforts.
-
3
Exploring SPSS Basics
SPSS Basics is an essential tool for researchers and analysts looking to analyze and interpret data. In this guide, we will explore the fundamental functions of SPSS, including data input, manipulation, and visualization. By familiarizing yourself with the basics of SPSS, you will be better equipped to conduct statistical analysis and draw meaningful conclusions from your data. Whether you are a beginner or looking to refresh your skills, this guide will provide you with the knowledge you need to navigate SPSS with confidence.
-
4
Introduction to Stata Software
Stata is a powerful statistical software used for data analysis, manipulation, and visualization. It is widely used by researchers, analysts, and policymakers to analyze complex data sets. With its user-friendly interface and robust set of features, Stata allows users to easily perform statistical tests, create graphs, and generate reports. Whether you are a beginner or an experienced data analyst, Stata is a valuable tool for conducting research and making data-driven decisions.
-
5
Data Entry and Verification Techniques
Data entry and verification techniques are critical for maintaining accurate and reliable data. By utilizing proven methods, such as double-entry verification and data validation checks, organizations can ensure the integrity of their data. These techniques help prevent errors and inconsistencies, ultimately improving the quality of the information being entered. Implementing effective data entry and verification practices is essential for data-driven decision making and overall operational efficiency.
-
6
Data Cleaning Best Practices
Data cleaning is an essential step in ensuring the accuracy and reliability of your data. By following best practices such as removing duplicates, correcting errors, and standardizing formats, you can improve the quality of your data. Regularly cleaning your data also helps prevent costly mistakes and ensures that your analysis is based on accurate information. By implementing these best practices, you can optimize the effectiveness of your data cleaning process.
-
7
Using SPSS for Data Management
SPSS is a powerful tool for data management, allowing users to efficiently organize and analyze large datasets. By utilizing SPSS, researchers can easily clean, transform, and manipulate their data to ensure accuracy and consistency. This software also offers advanced statistical capabilities, making it an essential tool for anyone working with complex data sets. With SPSS, users can streamline their data processing workflow and produce reliable results for their research or analysis projects.
-
8
Stata Data Manipulation Tools
Stata Data Manipulation Tools
Stata offers a wide range of data manipulation tools that allow users to efficiently clean, transform, and analyze their datasets. With functions such as merge, reshape, and generate, users can easily manipulate variables, create new ones, and merge different datasets together. Stata's powerful programming language also enables users to automate repetitive tasks and streamline their data manipulation processes. Whether you are a beginner or an advanced user, Stata's data manipulation tools provide the flexibility and efficiency needed to handle complex datasets with ease.
-
9
Hypothesis Testing Methods
Hypothesis testing methods are statistical techniques used to determine whether a hypothesis about a population parameter is true. Common methods include z-tests, t-tests, chi-square tests, and ANOVA. These methods help researchers make informed decisions based on sample data and can provide valuable insights for various fields such as medicine, economics, and social sciences.
-
10
Regression Analysis with SPSS
Regression Analysis with SPSS is a powerful statistical tool used to analyze the relationship between variables. With SPSS, researchers can explore the impact of one or more independent variables on a dependent variable. This allows for the prediction of future outcomes based on historical data. SPSS provides a user-friendly interface for conducting regression analysis, making it accessible to both novice and experienced users. By utilizing this software, researchers can make informed decisions and draw meaningful conclusions from their data. Overall, Regression Analysis with SPSS is an essential tool for any researcher looking to gain deeper insights into their data.
-
11
Advanced Stata Commands for Analysis
When conducting data analysis in Stata, utilizing advanced commands can greatly enhance the accuracy and efficiency of your results. Some key advanced Stata commands for analysis include "regress" for regression analysis, "xtabond2" for dynamic panel data analysis, and "ivregress" for instrumental variable regression. By mastering these commands, researchers can uncover deeper insights and make more informed decisions based on their data. Remember to carefully review the Stata documentation for each command to ensure proper usage and interpretation of results.
-
12
Comparative Analysis Tools in SPSS and Stata
When conducting comparative analysis in research, it is important to choose the right tools. SPSS and Stata are two popular statistical software programs used for this purpose. SPSS offers a user-friendly interface with a wide range of statistical tests and graphics options. Stata, on the other hand, is known for its powerful programming language and advanced data management capabilities. Both tools have their strengths and limitations, so it is essential to consider your research needs and skill level when choosing between them. Ultimately, the choice between SPSS and Stata will depend on the specific requirements of your project.
-
13
Drawing Insights from Statistical Results
When drawing insights from statistical results, it is essential to carefully analyze the data to extract meaningful conclusions. By examining patterns, trends, and relationships within the data, researchers can uncover valuable insights that can inform decision-making and drive improvements. It is important to use statistical techniques such as regression analysis, hypothesis testing, and confidence intervals to ensure the validity and reliability of the insights drawn. By taking a systematic and rigorous approach to analyzing statistical results, researchers can make informed decisions and identify opportunities for further research and exploration.
-
14
Creating Visualizations in SPSS
Visualizations in SPSS are a crucial aspect of data analysis, allowing for easier interpretation and presentation of results. By creating various charts, graphs, and plots in SPSS, users can effectively communicate their findings to others. Utilizing the visualization tools in SPSS can help highlight patterns, trends, and outliers in the data, making it easier to draw meaningful conclusions. Whether you are working with survey data, experimental results, or any other type of data set, creating visualizations in SPSS can enhance the quality and impact of your analysis.
-
15
Report Writing Guidelines
When it comes to report writing, following certain guidelines is crucial to ensure clarity and effectiveness. Start by outlining the purpose of the report and the intended audience. Organize your content logically with clear headings and subheadings. Use concise and formal language, avoiding jargon or ambiguous terms. Support your findings with reliable sources and data. Be sure to proofread your report for errors in grammar, spelling, and formatting. Finally, provide a clear conclusion that summarizes the key points and offers any recommendations. Following these guidelines will help you create a professional and impactful report.
-
16
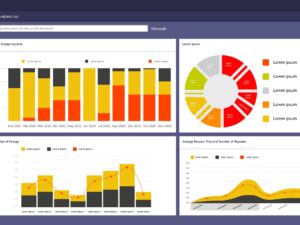
Presenting Data Findings Effectively
Presenting Data Findings Effectively is crucial in order to communicate information in a clear and concise manner. By using visual aids such as graphs, charts, and tables, you can help your audience better understand the data and draw meaningful conclusions. It is important to organize the data in a logical way and highlight key points to ensure that your audience can easily grasp the main findings. By presenting data in a visually appealing and easy-to-understand format, you can effectively convey your message and make a lasting impact on your audience.
- Course Title: Diploma in Applied Research Methodology Using SPSS and Stata
- Duration: 6 months
- Delivery Format: Online
- Instructors: Experienced professionals in research methodology
- Certificate: Upon successful completion
- Basic knowledge of research methods
- Access to a computer with SPSS and Stata installed
- Strong understanding of statistical analysis
- Proficiency in English language
- Commitment to self-paced learning
- Researchers looking to enhance their data analysis skills
- Students pursuing degrees in social sciences, business, or related fields
- Professionals seeking to improve their research methodology knowledge
- Anyone interested in learning advanced research techniques using SPSS and Stata
- Individuals aiming to make data-driven decisions in their work